 |
 |
 |
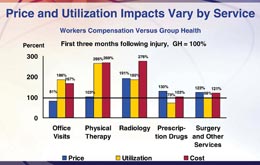
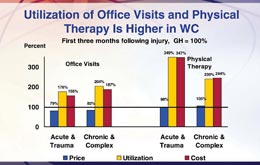
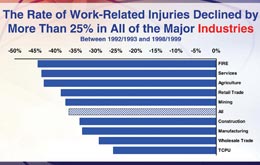
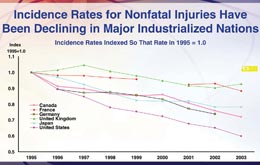
Medical costs drive comp results NCCI study finds comp pays 171% of group health costs for similar injuries/illnesses By Dennis H. Pillsbury The Annual Issues Symposium put on by the National Council on Compensation Insurance continues to be one of the most informative and interesting events of the year. And what is most surprising is the fact that the presentations by the actuaries are the highlight of the event year after year. This year was no exception. The report on the “State of the Line” by NCCI Chief Actuary Dennis Mealy, FCAS, MAAA, has always been a highlight of the meeting. And, as if having an actuarial presentation as a highlight—an entertaining and informative one at that—is not enough, then the real shocker is that this year he was upstaged by another actuary, NCCI Practice Leader and Senior Actuary Barry Lipton, FCAS, MAAA. Barry discussed Phase III of the NCCI study on “Workers Compensation and Group Health: A Comparison of Medical Costs.” It was not just Barry’s risible countenance that stole the show, although that certainly added to his cachet. It was, quite simply, that he had the best lines. And, as everyone knows, whether it be standup comedy or standup actuary, the best lines will out. All Dennis got to report on was an improving workers comp market where the combined ratio fell to an estimated 102 in 2005 from 107 in 2004. Not the stuff for drama. Barry, however, was able to provide the following: “One of the principal drivers for the higher health care costs in workers comp is office visits.” Now that was a showstopper. The audience quite literally was stunned. Phase I of the study looked at the prices paid for medical services and found that workers comp and group health were generally comparable, with workers comp paying lower prices than group health in states with fee schedules and higher in states without. Phase II included utilization of services and looked at total costs. This phase found that health care costs for similar injuries under workers comp were 71% higher than group health costs across 12 injury categories. Phase III found out where those costs were coming from during the first three months following the injury, and the aforementioned office visits played a prominent role, accounting for 23 points of the 71-point differential. Another 23 points was provided by physical therapy, while radiology accounted for 18 points and the balance came from prescription drugs and surgery and other services. One interesting fact about both office visits and physical therapy is that the price for both under workers compensation was similar and often lower than under group health, but utilization boosted the total cost precipitately. (See Chart I.) The study then looked at the breakdown between acute and trauma-related injuries and chronic and complex injuries. (See Chart II.) For acute and trauma-related injuries, the cost of office visits was actually lower than group health, coming in at 79% of the group health average. However, utilization was 76% higher than group health, resulting in total costs being 56% higher than group health. The story was similar for chronic and complex injuries, where the price of an office visit under workers comp was 83% of the group health cost, but utilization was 104% higher than group health, resulting in total costs being 87% higher than group health. A similar story existed in physical therapy, where the price under comp for acute and trauma-related injuries was 98% of group health prices, but utilization was 249% higher than group health, resulting in a total costs that were 247% higher for workers comp than for group health. For chronic and complex injuries, the price for physical therapy was 105% of group health, but utilization was 139% higher than group health, resulting in total costs under comp being 144% higher than group health. The end result of these higher costs for health care is that the cost for the average workers comp claim has more than doubled since 2003, rising 112% to $38,443. However, the average costs per worker during that same period increased only 46% to $471. “That’s because frequency was down 30%,” Dr. Harry Shuford, NCCI chief economist, reported. Shuford reported on NCCI economic research that looked into “the mystery of the disappearing frequency” and found that there were a lot of factors that have resulted in a steady decrease in frequency for 50 years. The study found that one of the reasons often cited for the decline—the changeover to a service economy—is not valid. In fact, the research found that the decline in frequency has occurred across all industries (See Chart III.). Shuford went on to note that the decline in frequency has occurred in all major industrialized nations. (See Chart IV.) He concluded that economic pressures have resulted in safer workplaces, noting that businesses that have fewer workplace injuries have a competitive advantage in the marketplace. Because of this, he concluded, “this is a trend that is likely to continue,” which is certainly good news for the workers comp industry. For additional information on these presentations, see the NCCI Web site at www.ncci.com. * |
|
|||||||||||||||||
| ||||||||||||||||||