|
Maximizing Automation Taming the data monster with Excel Part I—Filters and Functions By Wanda Schumaker Most agency management systems provide a wide array of “canned” or pre-defined reports. But, there are times when a spreadsheet program such as Excel can be an invaluable tool. Even with the ability in some systems to create custom reports, some of the basic features in Excel take the time and aggravation out of locating specific values, or sorting report data in ways that may not be regular options in the basic report output. Most current agency management systems have the ability to export basic report data to Excel so retyping the data is not necessary. This article will discuss the Excel Auto Filter as well as a few other data-related function fields, including using data sort and filter options. Depending on the specifics of your agency management system, if you have the capability of sending report output to Excel, it typically will not look like the report output itself. This is because the report printed output is a result of programming that aligns, page breaks, and subtotals the report. As such, the information you see in Excel will be “raw data” as it appears in your system database. It will be useful to determine what field names hold what criteria. Some vendors can provide data table structure, but you can usually ascertain the needed information by looking at the data pulled from the extraction to determine what field names represent what specific data. The following steps will help you manage your data extraction more effectively. 1. Simplify the language. Your system data table may have a field name called CLNAME that might mean “client name.” Some find it easier to change the Column Header (row 1 items) to a more familiar naming convention. So you simply type over the CLNAME and change it to CUSTOMER NAME.
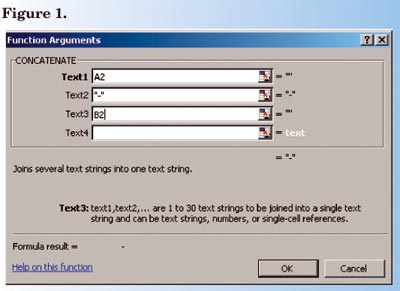
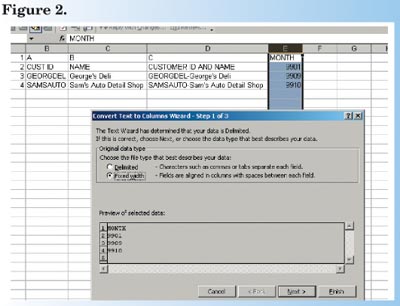
2. Combine Columns function: Concatenate. If you have one column that contains the customer code and another that contains the client name, consider using the Concatenate function. First, insert a new column. Label this column CUST ID CODE AND NAME. In the first blank record of that field, select the Function (fx) button and select the function Concatenate. (If it does not appear on the list of most recently used functions, typing it in the search field should find it quickly.) Once you choose this option, you will be presented a dialogue box that looks like Figure 1. In this example, cell A2 contains the customer ID code and cell B2 contains the full name. The “text2” box contains a dash (-) that acts as a text separator. See results of Concatentate function in the box under Figure 1. (Use copy and paste or fill handle to copy the formula in C2 to the rest of the cells in the column.) 3. Text to Column. Some data fields contain information that you may prefer to have in two columns instead of one. For example, if your transaction data holds the year and month as YYMM in a single field, use the Text to Column function to create two columns, one with year and the other with month. a. First, insert a new column immediately to the right of the current data column. b. Click on the column letter to highlight the entire column, then select Data from the menu and select Text to Column. (Figure 2 below.)
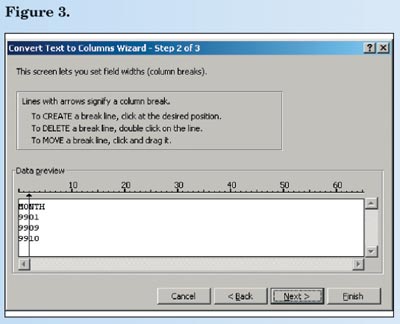
c. Choose Fixed Width and click the Next button. d. In Step 2 of the dialogue box, position your mouse and click to insert a line that represents where you want to split the columns. (If you insert a line that you don’t want, simply double click on it to remove it.) (Figure 3.) Click Next.
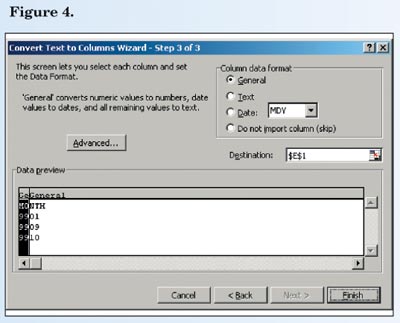
e. In Step 3, you can format the various columns, and you can even choose not to import one of the columns if it is not necessary for your final output by clicking on the column and selecting Do Not Import. You can also format the type of field as general, text, or date as needed. (See Figure 4.) Click Finish when complete. The result should appear as the example in the box below.
f. You will have a new column with the split data; simply re-label the column headers to Year and Month.
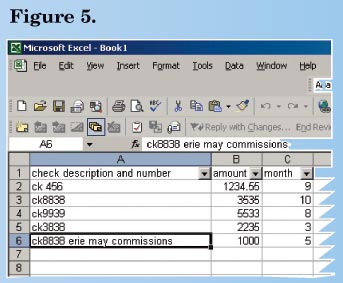
4. Auto Filter. Sometimes, all you need is to find a specific value in a sea of data. For example, if a client check number is contained in an “open text” field, it may not be possible to search from your system’s canned report options. Excel makes short work of this search with auto filter. In your data set, click on Data, then select Filter, then select Auto Filter. Auto Filter places an “arrow” button above each column in the database. (Figure 5.)
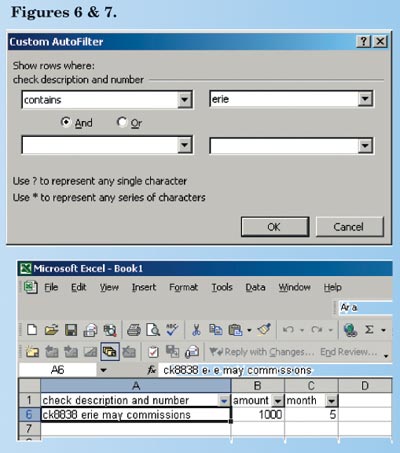
a. Opening the arrow button presents several filter options, including the ability to select a single value from the list and showing only those items. For example, you could open the Month arrow and request only month 8 to get August items. There is also a Custom option under each filter arrow that lets you expand your search. Let’s say that you were looking for all checks with the company name “Erie” in the description. The custom description filter permits you to select the Contains option and type the word Erie in the value field. Note that “Erie” does not have to be capitalized for the filter to find the values. (Figures 6 & 7.)
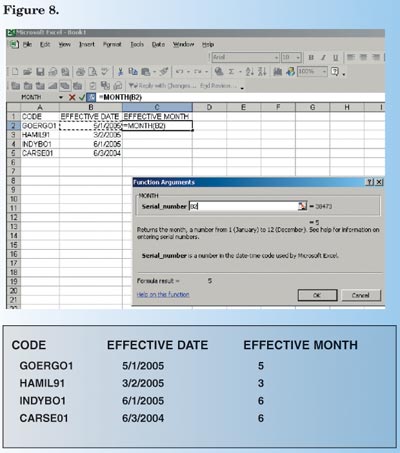
b. The list returns only the value that contains “Erie” in the content. When a filter is turned on and in use, the arrow is blue in color. You can also combine filters. For example, if you wanted to find all checks in August with Erie in the description, you would use the month filter first, then the custom filter in the check description column. To turn off all filters and return to full data list, simply go back to Data, Filter, Auto Filter, and uncheck to reset all data sorts. 5. Month function. If your system does not give you a way to run a book of business for a single month, consider sending your expiration data to an Excel worksheet and use the Month function. Perform the function on an existing date field, such as the Effective Date.
a. In a new cell, select the function Month and enter the cell reference you want to convert. (Figure 8.) b. Click OK and the result will display as month 1-12. c. Copy and paste formula to remaining cells. Notice that results for June return regardless of effective year. NOTE: If your Month column shows up with a “mm/dd/yyyy” value, select the column, then choose Format and format the cells as General to convert back to the desired value. Practical uses The key to effectively utilizing Excel is knowledge of your own data structure, how it is entered, and what you want out of it. As with any reporting tool, the outcome is only as accurate as the input. Several practical applications of the above include: 1. What months have the most policies per CSR? Use the Month function and perform a policy count by CSR code to assess workload on a monthly basis. This can help when needing to reassign workload, looking not only at total count, but when they fall in the year. 2. File label mail merge. Use the Concatenate feature, and word processing interface to merge the fields in the Excel sheet to a mass-print of file labels. 3. Extract check data. If you post your direct bill commissions to a single commission account but would like a way to find out what companies sent what check, use the Auto Filter, Custom to identify specific items (assuming specific detail contains this information)—then subtotal the amount fields. 4. File completion audits. Use the Auto Filter to identify fields that are blank that should contain data. Add subtotal points by user to provide a report that can be sent back for corrections. 5. Use Auto Filter to review a list of open invoices, audit transactions that are older than a certain date and/or greater than a certain amount due. 6. Use Text to Columns to strip out the first letter of the client code, then use that column to do a “count by alpha” of records on file. Why use Excel if we already have reports? Certainly, agencies should learn as much as possible about their existing canned reports. The key to report accuracy, aside from consistent data entry, is consistent report criteria selection. Admittedly, those who do use Excel should also be following the same kind of criteria used to run the canned reports. That is also why taking canned reports to Excel can be so useful. Rather than running five or six versions of the same paper report, take one version to Excel and extrapolate different data fields. Then you know the data set for each exercise is exactly the same. Always test your totals against the original system report to make sure the data you have exported stays viable. It is a good idea to save a copy of the original spreadsheet before applying functions and filters (just right-click on the worksheet tab and select the Copy option that suits your needs). Sending raw report data to Excel can also help you learn a lot about what is stored where, and in what format, in your database. This is powerful knowledge that may even help you make better use of your canned reports. In the coming months this column will examine other powerful Excel features, including Pivot Tables and Charts. * The author |
||||||||||
|


