

|
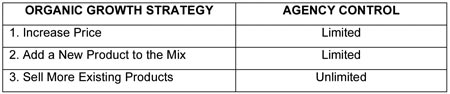
Building Equity Value Benchmarking revenue, driving value Concentrating on creating a sustainable growth engine By Patrick T. Linnert and Craig C. Niess First, the good news. Independent agencies should be commended for the operational progress they have made over the last 10 years. Many have realized marked improvements in employee productivity and expense control metrics. Such improvements have translated into increased agency profitability. Now for the bad news. The historical lack of attention to creating a sustain-able top line growth engine does not bode well for the continuing overall soft market conditions during 2006. By gaining an acute understanding of your revenue sources and metrics, you will be better prepared to control your agency's survivability while maximizing its value. Unless otherwise noted, all statistics referenced in this article were derived from the MarshBerry internal database. Overview Given past expense reductions, the amount of profit that can be gleaned from additional cost-cutting measures is limited. Many agencies are already running lean. As such, the most meaningful way to facilitate bottom line profit growth, especially in today's market environment, is through top line revenue enhancement. Economics 101 taught us that we can grow revenues in one of two ways: 1) externally (acquired growth) or 2) internally (organic growth). Most independent agencies do not have the capital or resources to actively acquire. Therefore, the focus for most should reside in organic growth. From an organic perspective, basic economics also teaches us that there are three ways to increase revenue organically:
a. Increase price. b. Add a new product to the mix. c. Sell more existing products. Let us quickly review these three internal growth strategies (Figure 1) and the control your agency has over them: Analyzing, benchmarking and augmenting your revenue growth strategy continue to be imperatives for a variety of reasons. The importance resides in such factors as: • Increasing agency profitability to maintain control over your desired exit strategy. • Carriers continue to tier their insurance distribution force by focusing on those agencies that place larger and more profitable business with them. • Your publicly traded competitors have competitive advantages, such as acquisition capital, thousands of existing clients from which to leverage cross-selling opportunities and infrastructure for domestic and international placement of business.
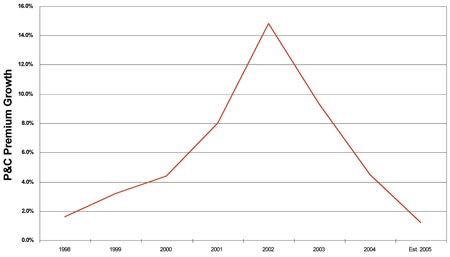
Price increases Agencies do not have direct control over insurance product pricing. Most insurance distributors see revenue fluctuate with the market in general. Setting aside fee-based and value-added services, let us review P&C premium increases over the last several years in Figure 2. Given the recent soft market conditions in the property/casualty segment, public brokers, bank-owned agencies and independent agencies have naturally seen a slowdown in organizational commissions and fees growth. P&C premium rate increases have been spiraling downward—from a 14.8% increase in 2002 to an estimated 1.2% increase for 2005. In 2005, despite catastrophic hurricanes in the South and flooding in the Northeast and West, the P&C insurance industry was well capitalized to handle insured losses. Combining still-strong surplus levels with a strengthening economy, company CEOs have openly expressed their desire to aggressively "buy" business. This translates into competitive pricing and continuing soft market conditions for most P&C lines.
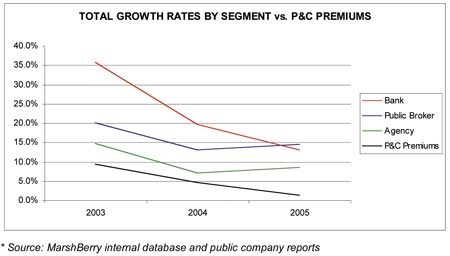
Furthermore, our best projections show an overall flat or slightly increasing rate environment over the next 12 months for most lines. Analysts do anticipate some hardening in specific lines of business most susceptible to catastrophic losses such as coastal property and offshore energy. Unless you maintain strong levels of such business, do not expect premiums to spur top line growth across the board. This is a compelling argument for selling more of your existing products. The graph in Figure 3 shows total growth by market segment. Using this as a guideline, you can gauge how your agency is performing compared to other market segments. The chart above illustrates that public brokers and banks are outpacing independent agents from a total growth perspective. As public brokers lack a sustainable organic growth culture, they have to acquire in order to hit Wall Street revenue and earnings targets. Leading banks in insurance continue to acquire because they are seeing the achievement of financial goals. This means that your competition is maintaining preferred relationships with carriers, building even larger capital reserves for reinvestment and carrying a larger inventory of products, expertise, and value-added services for clients. Obviously, public entities are leveraging acquisition capital, a luxury most independent agencies do not have. As such, you need to focus on organic growth in an effort to keep pace with competitor expansion. Product mix
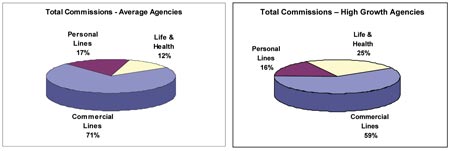
Because agencies are generally limited in the number of products they can offer, agency executives should analyze their product mix to gauge alternative strategies for additional sales. Untapped account rounding and cross-selling opportunities may be a great mechanism for selling new business. Let us now compare the product diversification of the average independent agency against the average high growth agency (Figure 4). While the number of insurance products available limits what you can sell, take advantage of those at your disposal. High growth agencies maintain a more diverse product mix vs. the average agency. This helps mitigate premium rate risk while facilitating cross-selling initiatives. Likewise, peak performing agencies place a greater degree of focus on the life and health/group benefits lines of business relative to the average agency. Just as banks focus on maximizing the number of products sold to each customer (wallet share) to minimize competitive incursions, so too should agencies focus on continued, but profitable, product sales to existing insurance consumers. Selling more existing products As insurance is typically a recurring revenue source and the number of sales is in the direct control of the agency, managers need to benchmark such sales in multiple ways. First, agency managers should look at net growth by line of business to assess strengths and weaknesses in selling available products. Second, agency managers must also assess new business production vs. client attrition.
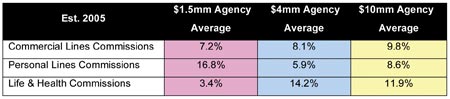
Line of business growth. Figure 5 will help you gauge how you are performing relative to the average performance in terms of organic commission growth by line of business. It is interesting to note that the highest growing line of business for the average $1.5 million agency is in the personal lines area. Numbers alone, however, tell little. It is imperative in benchmarking to ask the question "Why?" in an effort to uncover the story behind the numbers. In our average $1.5 million agency, the high personal lines growth might be attributable to increases in already low actual dollar amounts of personal lines business, hiring a personal lines producer or even pure reactive market sales. Conversely, the $4 million and $10 million agencies displayed the highest growth concentration in life and health/employee benefits lines due in large part to proactive strategic diversifica-tion and cross-selling strategies. Please keep in mind that the average agency will fail to perpetuate internally. Do not become complacent in settling for average. If you want to perpetuate and maximize the value of your organization, view these numbers as minimum performance metrics. Then establish goals well above the figures.
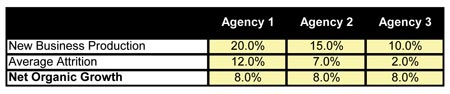
Production vs. retention. The average independent insurance agency (including all lines of business, agency sizes and agency geographic scope) realized approximately 8.0% organic commissions and fees growth during 2005. Again, the number by itself tells only a part of the organic growth story. Consider the example in Figure 6 of three agencies, each with 8.0% growth: While each agency realized comparable net organic growth, each may have different areas of concern when driving net growth during 2006. Agency 1 has strong new business production but may need to review and revamp its servicing capabilities. Agency 3, on the other hand, has great retention but might need to focus on additional new business initiatives to drive more sales. By comparing your new business production numbers to your average attrition rate, it will be clear where you need to focus your business priorities and enable you to plan accordingly. Most high growth agencies have developed a total agency sales culture where all agency personnel are focused on a winning combination of production and retention. The agencies that excel in both these areas are best positioned to maximize agency value and long-term sustainability. Contingents Contingents remain a viable, and often necessary, source of revenue for independent agents. Contingents are necessary because they help cover daily operating expenses and profitability. The larger the agency, the less dependent on contingent income the organization becomes. For most agencies, contingents represent over 80% of pre-tax profit figures. Granted, most agency owners will minimize year-end profitability through dividends or distributions, thereby skewing reported profit levels. But contingents then often become a necessary income stream in supporting an agency owner's lifestyle. Because contingents are not in your direct control, independent agency owners need to assess whether they could support both corporate expenses and personal lifestyle expenses should contingents cease. The best performing agencies treat contingent income for what it is—a bonus—and not as a necessary means to cover daily expenses or support individual lifestyles. A target you can use is to achieve pre-tax profit levels of 10.0% of net revenue after removing contingents from your revenue and profit figures. Your formula would look like the following: (Pre-Tax Profit less Contingents) ≥ 10% Again, only you know the story behind your numbers and the 10.0% target may not be right for your agency. The challenge, though, is to think about the way you are operating, understand numbers, decide where the risks may reside and make quantifiable changes. Conclusion Understanding your revenue metrics and developing a total agency sales culture is a must for future sustainability. By understanding the market as a whole relative to your organization, you will be better prepared to capitalize upon competitive advantages while correcting inefficiencies. Your publicly traded competition is being forced to drive revenue and earnings growth by external stockholders. Because of this outside pressure, your competition has created a well-defined plan to acquire, integrate and leverage. As independent agency executives, you are the sole or one of the few stockholders of your entity. Only you can force sustained revenue and earnings growth at your agency and you had best do it now. The best parting advice for you during 2006 is to assume and live by the mantra "Produce or Perish." * The authors |
||||||
|