|
NCCI sees a "precarious" market
for workers comp
Combined ratio soars to 110 in 2009; written premiums fall
23% in two years
By Dennis H. Pillsbury
The National Council on Compensation Insurance (NCCI) continues to offer one of the best meetings in the industry. The two-day Annual Issues Symposium, held this year in May, is packed with information about both the current state of workers comp and the many factors that will be influencing the comp market in the future. And 2009 proved to be a very interesting year on which to report. While the property/casualty market in general emerged from the financial crisis and subsequent downturn in the economy in very good shape, comp showed just how tied it is to the general economy and particularly to events that impact the job market.
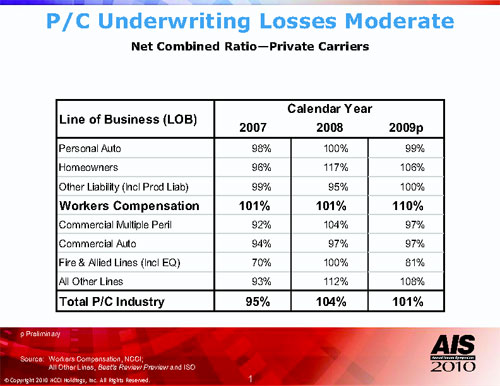
While nearly every line of business showed an improvement in the combined ratio that brought the total industry to a combined of 101 from 104 in 2008, comp and other liability headed in the wrong direction, with workers comp showing the most serious deterioration, with a combined ratio of 110 compared with 101 in 2008. Other liability deteriorated to a more acceptable combined of 100 from 95 in 2008. In fact, comp’s combined was the worst among all lines of business. (See Chart 1.)
 |
| |
| Chart 1 |
The results prompted NCCI President and CEO Steve Klingel to characterize the workers comp market as “precarious.” Speaking to a standing room only crowd, he noted that this appellation was not simply due to the “trying year of 2009,” but also to the fact that the line faces “a series of unknown factors—from the pace of economic recovery to the long-term impact of the new federal health care law.” Workers comp is “facing a host of challenges moving into 2010,” he concluded.
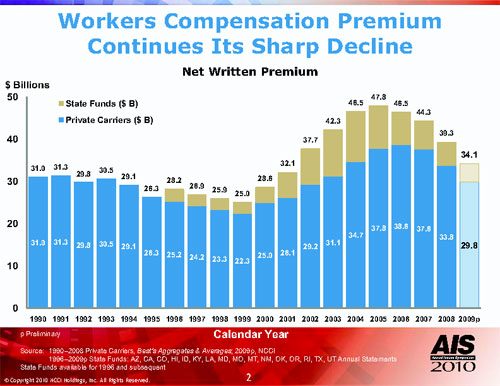
NCCI Chief Actuary Dennis Mealy, FCAS, MAAA, picked up the theme from Steve in his “State of the Line” report. “These deteriorating underwriting results, combined with the record low interest rate environment left the line at only slightly better than break-even after investment income is considered,” Mealy pointed out. “The calendar year net written premium declined precipitously again in 2009, for both private carriers and the state funds, as the recessionary impacts, particularly on manufacturing and contracting, along with price decreases driven by declining frequency and the competitive market, took their toll. Workers compensation written premium has declined 23% over the last two years.” (See Chart 2.)
 |
| |
| Chart 2 |
What happened to the comp premium?
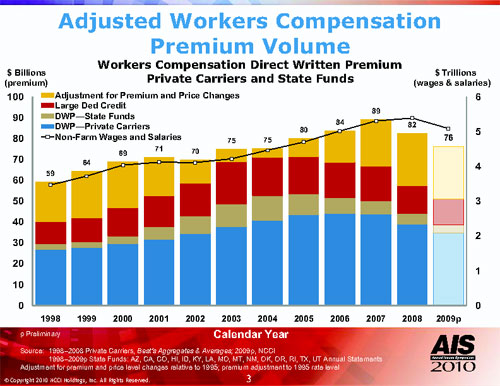
Mealy went on to look at what the premium would be if businesses all purchased full coverage at 1995 rates. The data show that by 2007, the workers comp industry would have been nearly a $90 billion industry. By 2009, that would have dropped to $76 billion. He then overlaid total wages and salaries to show the effects of the recession. Comp total premium and premium equivalents track closely with total wages until 2008 and 2009, even taking into account the reduced levels of wages and salaries caused by the recession. (See Chart 3.)
 |
| |
| Chart 3 |
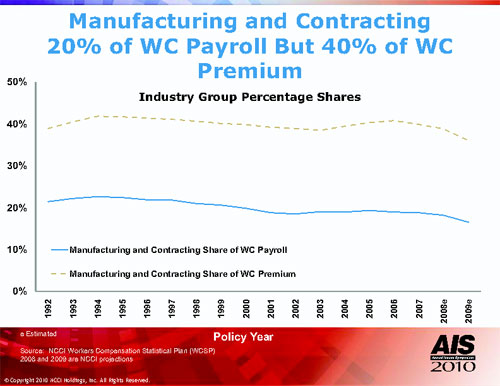
The data on employment show that the two higher-rated industry groups—construction and manufacturing—showed a marked decline in employment in 2008 and 2009. Those two areas normally account for 20% of employment, but 40% of workers comp premium. Because of the recession’s greater impact on employment in those two sectors, the economy had an even greater impact on workers comp premium. (See Chart 4.)
 |
| |
| Chart 4 |
“The good news is that, when employment begins to grow,” Mealy pointed out, “we would expect the converse. We might expect some additional premium both from the pick up in manufacturing and contracting employment, but also a pick up in smaller business employment, which accounts for most of the new jobs.” He noted that the reason the latter is important is because smaller businesses tend to purchase full coverage and normally pay a higher premium per employee.
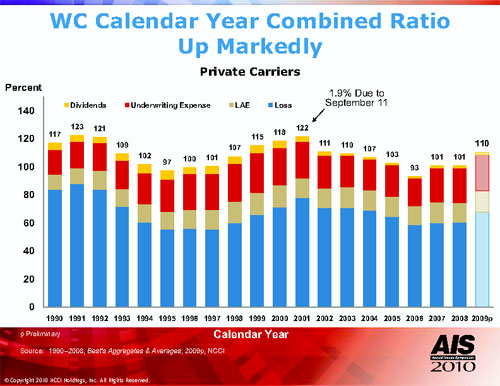
Turning to the combined ratio, Mealy noted that the 110 was “the worst combined ratio since 2003.” He noted that all components contributed to the deterioration. “The loss ratio was up about seven points; the expense ratio was up a point; and the loss adjustment expense ratio was up about a point.” He noted that the pattern was “eerily like the previous cycle with combined ratios being 97 in 1995, then 100, 101, and jumping to 107 in 1998. This time around it started with a 93 in 2006 then 101, 101 and a jump to 110. Mealy pointed out that the 110 combined ratio was impacted by a single carrier adding about $1 billion in excess workers comp reserves for accident years 2000 and prior. Excluding that reserve addition would lower the combined ratio to 107. (See Chart 5.) “There’s no doubt that the combined ratio for a while is going to head up,” he added.
 |
| |
| Chart 5 |
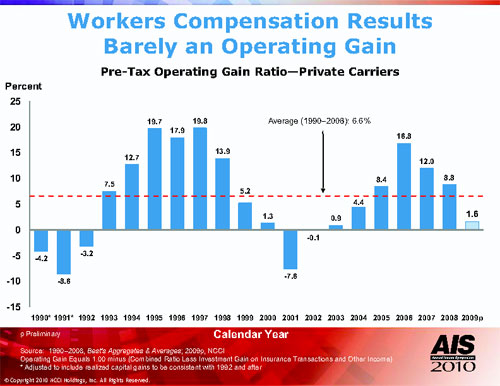
When the poor underwriting results are combined with lower investment returns, the industry shows a pre-tax operating gain of only 1.6%, substantially below the “relatively good numbers for the last three years,” Mealy said. “To provide a rough estimate of what we would need to return the cost of capital, in my opinion, this 1.6 would really need to be around nine or 10. So we’re not doing that well in this point in the cycle. You can clearly see the cyclicality of the earnings.” (See Chart 6.)
 |
| |
| Chart 6 |
Back in the late ’80s and early ’90s, he pointed out, there was a meltdown in comp. “Although things are tough right now, I don’t consider this a meltdown in comp yet.”
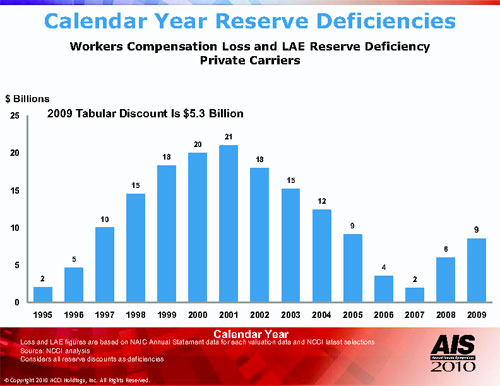
The estimate of the reserve deficiency “has ticked up a little bit,” Mealy noted. He pointed out that the $9 billion includes permissible discounting of about $5.3 billion for lifetime cases, making a reserve deficiency of about $4 billion, or 3% of the total reserves of $106 billion. “That’s pretty modest at this point in time but this is certainly something that we want to continue to watch,” he said, noting that “we can see what happened last time as things continued to deteriorate over time.” (See Chart 7.)
 |
| |
| Chart 7 |
A safer workplace
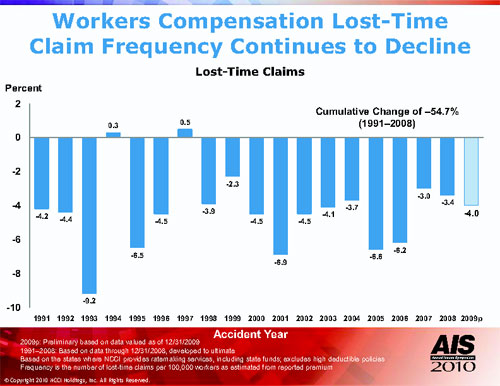
Although the cost of lost-time claims for both indemnity and medical has continued to grow, the good news is that the frequency of claims has shown a general drift downward, indicating that the American workplace has gotten safer over the years. (See Chart 8.) In the last 20 years, there were declines in the lost-time claim frequency in all but two years, producing a cumulative drop in frequency of nearly 55%.
 |
| |
| Chart 8 |
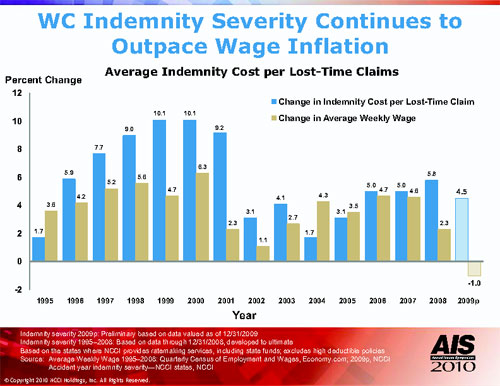
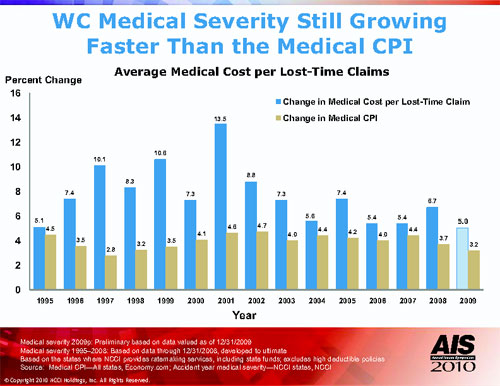
On the other hand, severity still remains a problem for both medical and indemnity. Workers comp indemnity severity has continued to outpace wage inflation (see Chart 9.) and medical severity is still growing faster than the medical CPI (See Chart 10.)
 |
| |
| Chart 9 |
 |
| |
| Chart 10 |
Conclusion
Mealy concluded that there are several positives for the industry: a strong capital position, the continued decline in frequency and slower growth in severity, and a continuation of residual market depopulation. On the negative side, however, are the low investment returns that will continue to put pressure on underwriting results; the underwriting cycle could be heading in the wrong direction; and legislation at both the federal and state levels could prove troubling. He expressed concern about potential reform erosion that could put upward pressure on indemnity costs.
Mealy also noted that the impact of national health care reform on workers compensation was uncertain, although one area—a change in Federal Black Lung benefits—will have a definite impact. And the potential changes in financial regulation could have an impact on comp as well.
|